I’ve moved over to using a new account at a new url. check out http://rorynealon.com for further post updates!
New URL
Reply
I’ve moved over to using a new account at a new url. check out http://rorynealon.com for further post updates!
I am working on a map that contains a lot of sequential data as well as transportation lines and political boundaries. Having had very limited experience with html (used to style legends in TillMill) I wanted to find a quick solution to get my data in two columns, one for the sequential data and one for the rest.
I stumbled across Matt Danner’s blog piece which is a very elegant solution:
<div style="float: left; width: 50%;">
<ul>
<li>Left Item 1</li>
<li>Left Item 2</li>
<li>Left Item 3</li>
<li>Left Item 4</li>
<li>Left Item 5</li>
</ul>
</div>
<div style="float: right; width: 50%;">
<ul>
<li>Right Item 1</li>
<li>Right Item 2</li>
<li>Right Item 3</li>
<li>Right Item 4</li>
<li>Right Item 5</li>
</ul>
</div>
As seen below it worked perfectly.

And here is how the html was implemented to get the above result:
<div style="float: left; width: 50%;">
 <ul class='legend-labels'>
 <span style='color:#eee'>▉</span> 5% < </li> <br>
 <span style='color:#bbb'>▉</span> 5% - 10%</li> <br>
 <span style='color:#aaa'>▉</span> 10% - 15%</li> <br>
 <span style='color:#999'>▉</span> 15% - 20%</li> <br>
 <span style='color:#888'>▉</span> 20% - 25%</li> <br>
 <span style='color:#666'>▉</span> 25% - 30%</li> <br>
 <span style='color:#555'>▉</span> 30% - 35%</li> <br>
 <span style='color:#444'>▉</span> 35% - 40%</li> <br>
 <span style='color:#333'>▉</span> 40% - 45%</li> <br>
 </ul>
 </div>
<div style="float: right; width: 50%;">
 <ul>
 <span style='color:#000'><img src="https://db.tt/rjPrfl5B" height="30" width="20"></span> Amtrak Station <br>
 <span style='color:#000'><img src="https://db.tt/1EttCeFm" height="30" width="20"> </span> Major Roads <br>
 <span style='color:#000'><img src="https://db.tt/ME3dpnuw" height="30" width="20"> </span> Roads <br>
 <span style='color:#000'><img src="https://db.tt/s6Xtf3Vn" height="30" width="20"> </span> RTD<br>
 <span style='color:#000'><img src="https://db.tt/lT2BgHni" height="20" width="20"> </span> 1/2 Mile Buffer<br>
 </ul>
 </div>

From September 5th – 7th, I had the honor to attend and present a paper from my thesis at the International Society for the Scientific Study of Subjectivity‘s 29th Annual Q conference in Amsterdam, The Netherlands.
Grouped in the Poli Sci sessions, I presented opposite S.R. Brown and was surprised by the turnout and the the thoughtful questions that were asked. As having taught this statistical method to myself it was a nice capstone to the work I put in, and an affirmation that the research and work I did was not totally off base.
Getting to meet Professor Brown, and Job van Excel, both whose work I relied heavily on for my research, was a real treat. Also seeing the work that others have applied Q to was quit interesting.
Further as it made economical sense to join the ISSSS and use the membership to join the conference than it was it just attend the conference, I got to participate in the business side of the conference and helped push its journal over to be open access.
Although it doesn’t seem as if I will have the chance to use this method anytime soon, It would be great to continue my work with it as this was only my first opportunity to explore it.
This week I started working a part time gig with t4america. I will be using census data to analyze different trends to help provide a narrative about about millennials desires, needs, and wants as far as living and transportation. More to come!
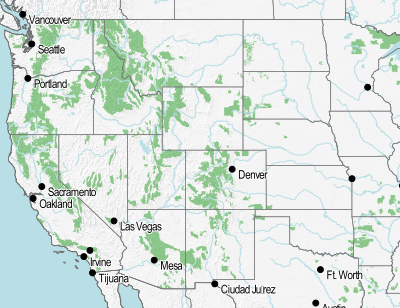
Quick Map I made in TileMill during my time at the Urban Ecology Institute.
In this map I used TileMill’s location functionality for the first time. This lets you click on a part of the map and have it linked to a URL and thus open a website. In my case I wanted to link the different US Forestry Service areas to their specific pages. At first i tried using the existing name field in the attribute table of the file and setting it to come after http://www.fs.usda.gov/{{{ForestName}}} however while most of the forest’s websites use this naming convention for their website, not all do. Some have abbreviations, others are in completely different formats.
I was hoping to find a more elegant solution, but the easiest way was to pull the links from the USFS website using the chrome extension Linkclump (Git). The urls were then moved into a csv file. The file was then joined to the USFS forest file and a new attribute Website was created with the URLs for each. It works nicely, if I do say so my self and you can test it out here.
After graduating from my M.Sc. program in the Netherlands, I took an internship in Cambridge MA with the Urban Ecology Institute. Its a non-profit started in the 1980s by Robert Kennedy Jr and you guessed it advocates and works on Urban Ecology issues. Their focus over the years has become Urban Trees and I was brought on to use GIS in this regards.
The focus of my work was preparing for Boston’s 2014 Street Tree Inventory. They last performed one in 2008 and the city wanted to update their data on existing trees as well as capture the trees that had been planted.
My work with this took two forms. First I designed a mobile data acquisition app (for both Andiod and iOS) that volunteers would use in the survey. It was created using Fulcrum. A screen shot of the mock up is included below.

I was also charged with dividing Boston into the different zones that volunteers would survey in a day. The requirements where that the zones had to fall within a single Boston neighborhood, contain between 120 – 200 trees (as of the 2008 street tree inventory) and be more or less uniformly sized.
To create them I used an add on to ArcGIS called the Districting tool. It essentially lets you manually merge polygons while keeping essential summary satistics of the new polygons in a window. Thus If i selected a census block (which I had previously performed a spatial join on with the street trees point file to sum the number of trees it contained) with 5 trees and another with 10 , it would display that I have selected areas that contain a total of 15 trees.
There were several alternative programs for automatic zone design based on preset parameters, however they had a steep learning curve or costed to much. If I had more time I would have liked to have considered using one of them.
I originally was using a google spreedsheet to record the birdsI saw. I would then have to manually update the Page in wordpress with what I had seen.
To expediate the process and reduce the tedious amount of clicks this took, I decided to try and embed the sheet directly in my “Bird List” page. Big thanks to the “American Muslim Mom” youtube video for showing how easy it was (google has moved the buttons around since they published the video but they aren’t hard to find).
As can be seen on the page, I was more or less successful in embedding the spreadsheet, however I would like to tweak it a bit. First I wasn’t able to embed a specific range of cells or columns to the page. This should be possible with google’s web publish functionality, however it doesn’t seem to work for me. Possibly the script i’m running is interfering?
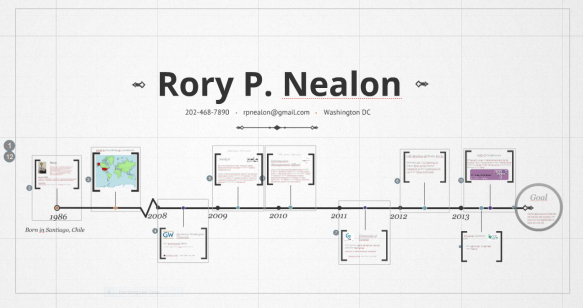
I played around with prezi, an online slideshow tool that specializes in transitions, to create my CV in a timeline format. Its based on an existing template but a neat non-traditional way to view my expereince

I had a bike accident which was serious enough for me to ride an ambulance to the hospital on Monday, May 6th. While I only ended up with 3 stitches across my brow and a sore right elbow. I was treated as a trauma patient and had to undergo a series of tests to check the extent I had injured myself.
The above picture is not an egg but my brain, luckily I got a clean bill of health in that department. I will be taking it easy for now but should be back in action soon.
I submitted the thesis I wrote for my M.Sc. to a conference on the methodology I used and as the below e-mail would suggest, it was accepted! I will be busy whittling it down and fixing it up to fit the specified format. Can’t wait to attend September 5th – 7th in Amsterdam.
Dear colleague,
Thank you for submitting your abstract(s) for the Q conference in Amsterdam. Your abstract(s) will be reviewed and you will receive notification of the result by the end of April.
This confirmation email was sent to the first author on the abstract only. Please notify your co-authors, if you think this is required at this stage.
Best wishes, hope to see you in Amsterdam,
Job van Exel
Programme Chair
